
.svg)
.svg)

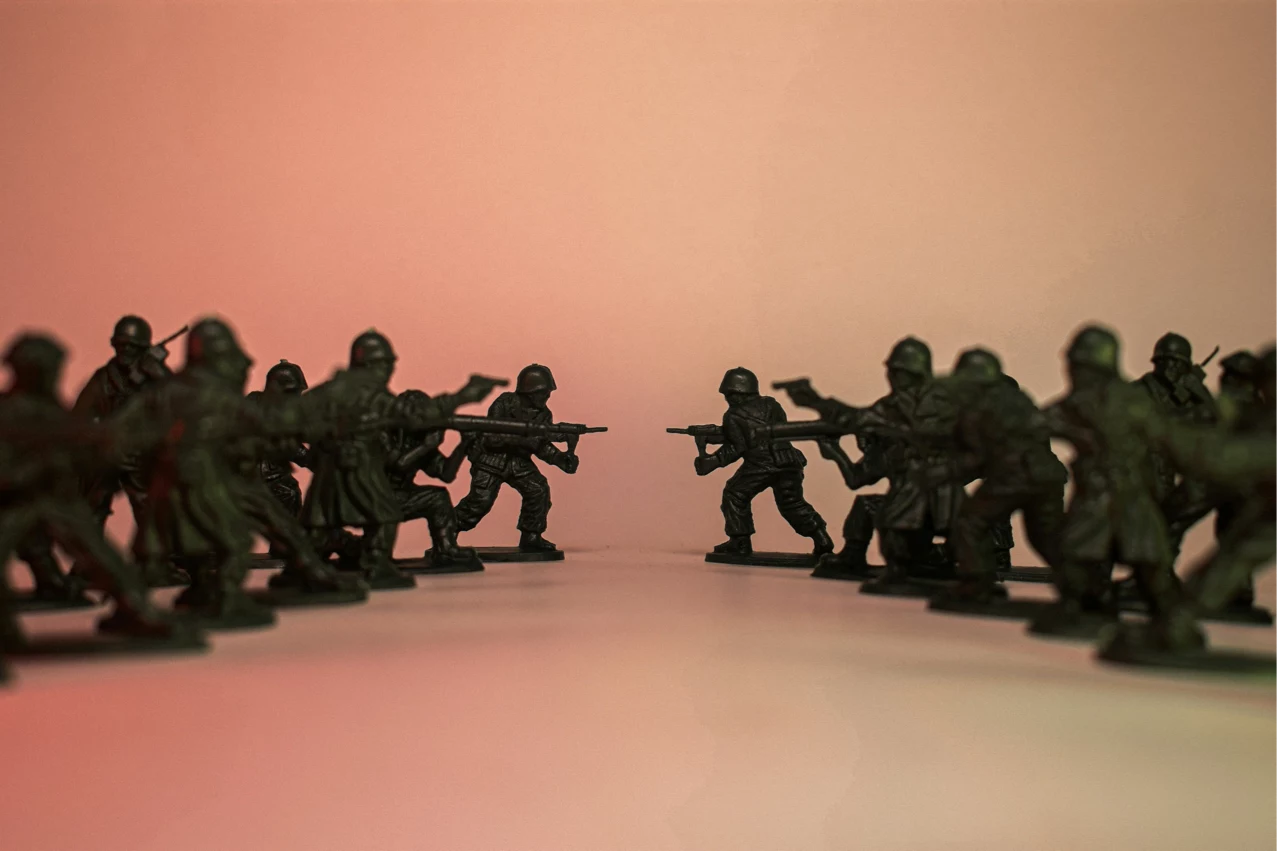
Red Team Versus Blue in Cybersecurity:
How Adversarial Combat Models can train AI to help detect and respond dynamically to threats and discover hidden vulnerabilities.
Wargaming can be traced back to 1824, when Georg von Reisswitz, a Prussian army officer presented a radical new idea to the Prussian Army, based on a game he’d been developing with his father for 20 years using data from the Napoleonic Wars.
Earlier models used chess boards, and the pieces were coloured Red and Blue. This has now become military convention in the West, and has passed down in turn to the world of cybersecurity.
The Blue Team is friendly, the Red Team is the enemy. The Soviet Army of course embraced the colour Red, and so Blue became the enemy in Russian military strategic planning.
The checkerboard was quickly replaced with realistic maps, so that each battle unit could game against the actual terrain, which included all the geographic features, as well as defence lines and natural barriers e.g. rivers so the gaming could be highly realistic over the exact geography of an upcoming battle.
The basic idea was to use the gaming to gain a better command of unpredictable events (aka “frictions” in military terminology) and hence improve dynamic decision making in response to adverse effects.
"No plan survives first contact with the enemy”
The well known military dictum; “ No plan survives first contact with the enemy” is one of the only truisms in warfare. Getting your army to dynamically respond to events on the battlefield, as we have seen in even the most recent conflicts, is incredibly challenging.
Simulations to allow senior leaders to practice their decision making skills, is one of the proven methods that actually helps to improve strategic decision making based on responding to fresh battle circumstances, rather than responding constantly to the caprice of political winds.
How did they simulate these unpredictable frictions?
Turns out using the dice was a great method to provide a predictable range of unforeseen consequences. Dice controlled the actual progress on the battlefield and casualty rates, and artillery and firearms decreased in efficiency by distance. Each of the units had a table for how far it could move, according to the unit, for example, walking, trotting, galloping, along with the firepower for that unit.
Unleashing Tactical Simulations in Modern Cybersecurity
The wargaming was quickly adopted by Cybersecurity due to its inherent value at modeling the unpredictable nature of attacks, and allowing teams to develop the dynamic critical thinking skills needed to respond to the enemy actions in real-time.
The Red Team
In cybersecurity, red teaming is a full-blown multi-layered attack simulation designed to measure how well an organization’s computer networks, software applications, and physical security controls can withstand an attack from a real cybercriminal. The Red Team, orchestrates strategic offensives to pinpoint vulnerabilities within an organization's security infrastructure. Through meticulous simulations, they emulate real-world threats, probing defenses and exposing potential weak links.
The Role of Blue Teams
Blue Teams act as the defenders of the digital realms, deploying defensive strategies to thwart cyber threats. Blue Teaming's reactive approach tries to simulate a rapid and co-ordinated response to cyber threats. Just as in real-life, incident response and threat mitigation is greatly helped by experience of prior events.
Collaboration and Communication
The real value from the Red Team Versus Blue Team simulations is in the collaboration and learning between the Red Team and Blue Team. Continuous communication and feedback loops help to create an adaptive security mindset, where insights gained from Red Team exercises inform and enhance the Blue Team's defensive capabilities.
Collaboration and communication is essential for an organization to achieve higher levels of cyber resilience than it could in isolation. This all takes considerable expertise, time and resources. You need to set up separate Blue and Red team resources, with the necessary domain knowledge and security backgrounds, and then work hard to establish the right communication and feedback mechanisms between the teams.
Large cybersecurity teams struggle with this, just as today’s militaries struggle today. It’s inherently a complex and difficult learning experience that takes time and stable teams and first-rate management skills to perform at peak.
Meanwhile, smaller companies aren’t even trying. They just don’t have the time and resources.
This is where VerifiedThreat comes into its own. We provide the red teaming dynamically by adapting our 12,000 intelligence agents with the latest threat intelligence, and continually searching for vulnerabilities, with the actual code and breakdown of the vulnerabilities. The Blue Team then has prioritized list of actual vulnerabilities along with the evidential proof of the attack, all indexed by business priority.
AI Advanced Techniques and Tools for Red Team v Blue Team
It turns out that the Red Team versus Blue team gaming can also be extremely useful in training AI models. Setting up the Red Team v Blue Team structure and training is complex, expensive and relies on the team's extensive communication ability. However, in AI we already have a framework for measuring effectiveness of our decision making, called the Confusion Matrix.
The Confusion Matrix

When we assess the efficacy of machine learning models, we identify all the outcomes using the confusion matrix to help us understand the consequences of our ML features and current model.
To understand this, let’s take a simple flip of a coin. We predict heads or tails. Our prediction is either right or wrong. So there are only four possibilities for each of our predictions vs. what actually happened.
We call heads. The result is heads. It’s a true positive. We call heads, the result is tails. It’s a false positive. Then do the same for tails, and we have all four possible results.

Real World Example of an ATO Attack
Let’s take a real world example. In the graph the red dots are malicious account takeovers. The Blue Dots are legitimate logins. Our model attempts to provide a breakdown for showing the distribution of the attack. Now we will show the results plotted below of the Confusion Matrix to display the accuracy of the results.
Plotting the Results on a Confusion Matrix

We can see from the Confusion Matrix, we’ve done a reasonable job with the human data. We only have one false positive. It’s 96% accurate, that’s a great result isn’t it? Let’s have a look in more detail.

Given both false outcomes, which is worse?
The False negatives aren’t great - it's the boy who cried wolf, but at least we err on the side of caution. More annoying than fatal.
It’s the false negatives that cause the real damage. In this case our system says all is normal, but our model mis-classified an attacker as a normal human behaviour. That is much more of a problem. Now our own machine learning training is labeling the attack itself as a valid user, which fundamentally can destroy the model's efficacy if it is not picked up and corrected.
Red Team V. Blue Team Accuracy Testing.
Although the confusion matrix provides a good overview, in cybersecurity we are much more concerned about an attacker that is incorrectly validated as human, than an attacker we think is human.
Challenging a human is not such an issue, allowing an automated agent to infiltrate the model as a human is a massive problem. It’s really not that useful in assessing our overall effectiveness against the Red Team attacks
In order to understand the relative effects of both we need to plot the true positive rate versus the false negative rate dynamically over time.
Once again our military cousins are one step ahead of us again. The Receiver Operating Characteristic Curve (ROC) originated from its use in WW II radar communications. The radar operators (hence receiver) had to decide if a blip on the tiny radar screen was a real Red attack object, or merely some noisy signal. Essentially it is a trade-off between sensitivity (true positives) and specificity (true negatives). The ROC curve shows us how our model is performing at different classification thresholds. An ROC curve (receiver operating characteristic curve) is a graph showing the performance of a classification model at ALL classification thresholds.
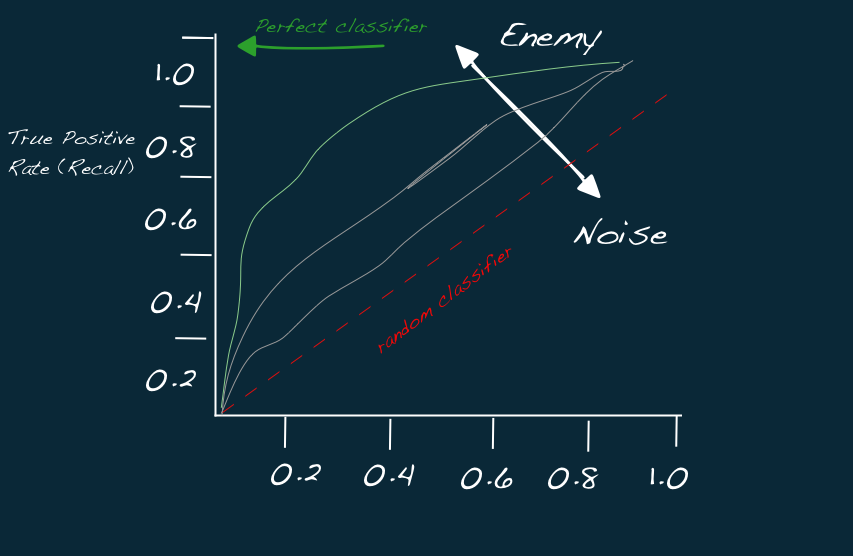
ROC Curve in Cybersecurity
Now we can see how this curve plots the true positive rate versus the false positive rate. You can set thresholds for your predicted confidence levels, and calculate the true positive rate (TPR) and false positive rate (FPR) accordingly. With the radar, it really helped to adjust the sensitivity of the equipment to establish the best operating modes for detection. However, for Cybersecurity applications we are likely to have different classification thresholds, which have to be calculated each time. Luckily, there is a better way - which brings us onto the preferred method for measuring the combined effects of the Blue and Red Team outputs.
Key Differences between Red and Blue Teams
Taking our ROC curve, we now measure the Area Under the Curve (AUC) as shown on the left. It has three major advantages for Cybersecurity.

- AUC is scale agnostic. It measures how well predictions are ranked, not the absolute values.
- AUC is also classification-threshold agnostic. It measures the quality of the model’s predictions at all classifications.
- The third major benefit is that results are plotted as Bernoulli distributions, i.e. a number between 0 and 1. This is super helpful for developing risk models that are then incorporated into other risk detectors in combination, to highlight the actual business risk and impact.
Red Team Versus Blue Labeling of Human or Automated Data
Now we have a powerful structure for understanding the Red Teams simulated attacks, and probing vulnerabilities, and we can put into context the Blue Teams defenses, ensuring that we can use constant trial and error in the gaming - introducing our military frictions so that we can better map out our responses. Most importantly we now have a basic understanding of the efficacy of our models, and how accurate we are at detecting the attacks from normal human behaviour. This works at a massive scale, and constantly learns and adapts.
Real-world Applications
Often our Red and Blue Teams use real-attack threats from the dark web or from using the hacker tools and services most frequently used. Of course today, this also heavily means we use AI to test the AI. This allows us to test our defences against actual attacks with real-world data, on a constant basis.
This proactive threat testing ensures we can be on top of the most common and professional cyber threats and ensure our models are capturing the appropriate risks.
Common Real-world Modeling Errors
Overfitting Data
Each data label is mapped by the model, including outliers following the exact distribution of all the data points. It may therefore fail to predict future observations
Underfitting Data
The model just isn’t performing and may cut off a portion of the data that does not reflect the real distribution pattern. The underlying data structure is not captured reliably.
Generalisation
Typically in Cybersecurity applications we are looking to generalize a model that works even on examples not seen by the model when it was learning. Humans are exceptional creatures, and the hackers attacks make full use of the differences to try and sneak past our defences.
The Human Factor in Cybersecurity
Beyond technology, the human factor is critical. Red and Blue Teams emphasize education, awareness, and training to empower individuals in maintaining cybersecurity.





.svg)
.svg)